
Bitcoin price recovered further and surged above the $38,000 resistance against the US Dollar. BTC even spiked above $40,000 and it is likely preparing for more upsides.
- Bitcoin remained well bid and it managed to climb above the 38,000 and $38,500 resistance levels.
- The price is now trading nicely above the $38,500 level and the 100 hourly simple moving average.
- There is a key contracting triangle forming with resistance near $39,425 on the hourly chart of the BTC/USD pair (data feed from Kraken).
- The pair could surge again if it clears the $39,400 and $39,500 resistance levels in the near term.
Bitcoin Price Gains Traction
After a successful break and a follow up move above $36,000, bitcoin price started a strong increase. BTC broke a couple of key hurdles near the $38,000 level to move further into a bullish zone.
The price gained pace and broke the $39,200 resistance. It even spiked above the $40,000 resistance and settled above the 100 hourly simple moving average. A high is formed near the $40,212 level and the price is currently consolidating gains.
It corrected below the $39,500 and $39,200 levels. A low is formed near $38,052 level and the price is currently forming a breakout pattern. It climbed above the 50% Fib retracement level of the recent decline from the $40,212 high to $38,052 low.
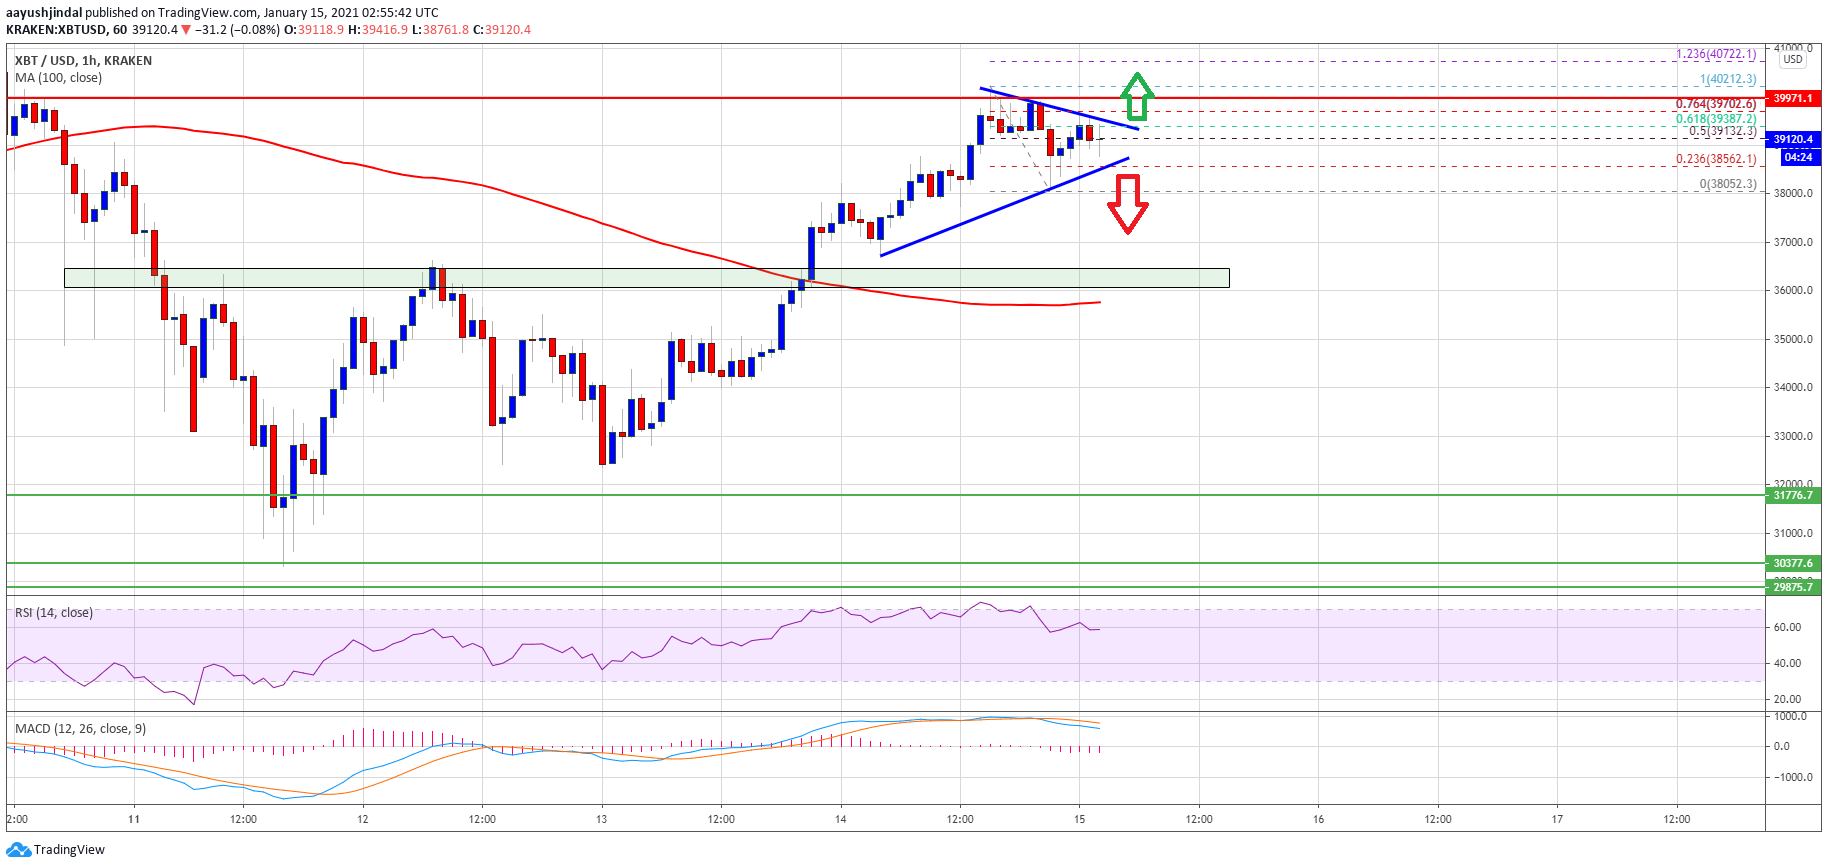
It seems like there is a key contracting triangle forming with resistance near $39,425 on the hourly chart of the BTC/USD pair. The triangle resistance is close to the 61.8% Fib retracement level of the recent decline from the $40,212 high to $38,052 low.
If there is a clear upside break above the triangle resistance, the price could clear the $40,000 level. In the stated case, bitcoin price might aim a strong surge and the bulls are likely to aim a new all-time high in the coming sessions.
Fresh Dip in BTC?
If bitcoin fails to clear the triangle resistance and $40,000, there is a risk of a fresh decline. An initial support is near the $38,500 level.
A downside break below the $38,500 and $38,000 support levels may possibly push the price towards the main $36,000 support zone in the near term.
Technical indicators:
Hourly MACD – The MACD is slowly losing momentum in the bullish zone.
Hourly RSI (Relative Strength Index) – The RSI for BTC/USD is moving lower towards the 50 level.
Major Support Levels – $38,500, followed by $36,000.
Major Resistance Levels – $39,450, $40,000 and $41,800.
—
First published here


